[Date Prev][Date Next][Thread Prev][Thread Next]
[Date Index]
[Thread Index]
- Subject: Re: [ANN] LuaJIT-2.0.0-beta1
- From: Mike Pall <mikelu-0911@...>
- Date: Sun, 1 Nov 2009 17:06:10 +0100
Geoff Leyland wrote:
> Here are some more results (this time making it clear that LJ2 is much
> better!):
Ah, nice!
> Times are measured with os.time(), so not much resolution.
Consider using os.clock().
> I tried -jv, but it didn't give me a breakdown of what was interpreted
> and what was JIT compiled - how did you get that?
I have a profiler on the backburner. Gives output like this
(speed test of binary heap):
39.2 interpreter
34.9 5 binary_heap.lua:101
10.9 GC
5.6 1 binary_heap.lua:69
3.0 C functions
2.8 7 (5/3) binary_heap.lua:42
1.9 6 (5/11) binary_heap.lua:42
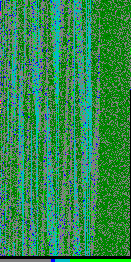
It also visualizes the different states. See the attached image.
Green is native code, the shades indicate different traces. If
this looks noisy, this means it's jumping between traces a lot.
Grey is the interpreter, blue are C functions, cyan is the GC. The
red to yellow shades show the compiler itself (it's fast, that's
why you don't see much of it).
Time goes top->down first, then left->right. The scale at the
bottom summarizes the different states. It's able to sample at
higher resolutions. But I didn't want to dump a big image to the
mailing list.
SciMark looks much nicer -- pure green. :-)
Not sure whether there is enough interest in the profiler. Maybe
that's also something for a commercial add-on, to aid in financing
the project.
> The kdtree code is in the same place as the heap stuff, but there's no
> test harness or data. If you'd like that, let me know and I'll put
> something together. The map preprocessing stuff will be harder (but
> possible) to isolate.
I'm always interested in independent benchmarks. Because the
benchmarks I write myself are biased (I know what compiles well).
--Mike
Attachment:
vmprof_heap_speed_binary.png
Description: PNG image